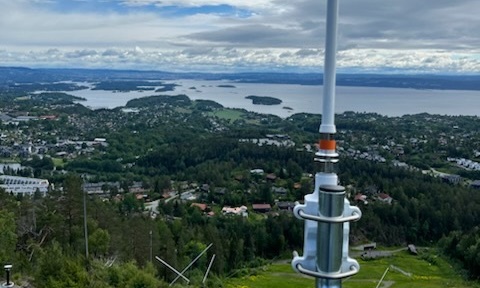
20,000+
meters · LoRaWAN + wM-Bus hybrid
Three vendors replaced by one platform. Kamstrup, Axioma and Apator meters on the same console, with native Komtek billing – the widest range of LoRaWAN + wM-Bus technology in a single Nordic project today.

Water intelligence
No pipe network is watertight. The question worth asking is how big the leak bill is and which streets it sits under. Divako keeps the water balance continuously – input against billed consumption, zone by zone – so loss stops being an annual estimate and becomes a number you can act on this week.
Water loss management is the practice of measuring, explaining and reducing the gap between the water a utility produces and the water it bills for. In a typical municipal network somewhere between 10% and 30% of treated water never reaches a bill – water that was pumped, treated and paid for before it disappeared.
The gap is not one thing. Part of it left through a hole in a pipe. Part of it reached a tap and was mismeasured on the way, by a tired meter or a data feed that stopped. And part of it the utility handed out on purpose – hydrant flushing, firefighting, mains maintenance – which is fine, as long as somebody wrote it down. A crew with listening sticks fixes the first, a meter-replacement programme fixes the second, and plain bookkeeping fixes the third, so telling them apart is the first real task.
meters · LoRaWAN + wM-Bus hybrid
Three vendors replaced by one platform. Kamstrup, Axioma and Apator meters on the same console, with native Komtek billing – the widest range of LoRaWAN + wM-Bus technology in a single Nordic project today.
Questions
Water you produced and never invoiced. Three unrelated problems hide inside that single figure: water that escaped through a hole in a pipe, water that reached a tap but was mismeasured or never measured at all, and water the utility deliberately gave away – hydrant flushing, firefighting, mains maintenance.
Because the subtraction is easy and the calendar is not. A zone meter logged at midnight, set against customer meters collected over the following three weeks, compares two different stretches of time – and what falls out is arithmetic noise wearing the word “loss”. Line every meter in the zone up on one timestamp and the remainder starts to mean something.
No. Start where the water comes in, add meters on the edges of your biggest districts next, and fill in the customer side district by district after that. Even a once-a-month figure for one district tells you more than a yearly number for the whole network.
Since the 2020 recast, directive 2020/2184, leakage has stopped being an internal KPI. Each member state had to work out how much its networks lose – by Infrastructure Leakage Index or a method of comparable rigour – and file the answer in Brussels ahead of 12 January 2026. The Commission then has until 12 January 2028 to name a figure nobody should exceed; anyone sitting above it owes an action plan.
Your zones
Send us your zone layout and tell us where the input meters sit. We'll sketch the first balance you could actually run, and what stands between you and it, in about 30 minutes.