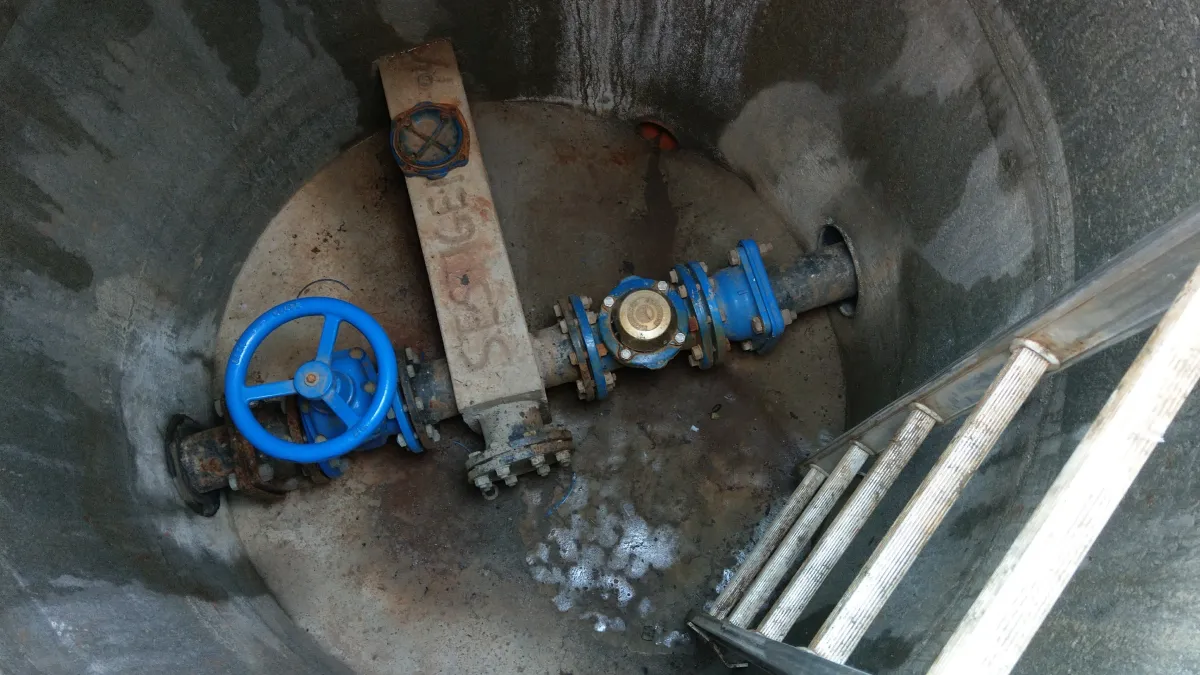
The IWA water balance explained
A practical guide to the IWA water balance: its components, data sources and the checks needed for a reliable leakage estimate.


Industry · 5 October 2026
Calculate ILI step by step on one example network: build the water balance, collect the four UARL inputs, and check the result.
The arithmetic at the end of an ILI calculation is one division. The work is everything that produces the two numbers going into it — and most of that work is in the numerator, because real losses are not measured directly. They are what is left after you have accounted for everything else.
This walks the whole calculation through on a single network.
Two decisions that are easy to skip and expensive to revisit.
The period. Use a full year for an annual ILI assessment and align all volumes to the same dates. Shorter periods can help with operational monitoring, but seasonal demand and repairs affect comparisons. This example assumes 365 days of continuous supply.
The boundary. Identify every inlet and outlet of the network being assessed. Include imported water in system input and record exported water as authorised consumption. If you instead calculate a distribution-only balance after subtracting exports from input, exclude those exports from consumption too. Never subtract them twice. Our example has no exports.
Use the IWA water balance to estimate current annual real losses (CARL). Two subtractions give the result:
Water losses = System input volume − Authorised consumption
Real losses (CARL) = Water losses − Apparent losses
Our example network for the year:
| Component | m³/year |
|---|---|
| System input volume | 1,500,000 |
| Billed metered consumption | 1,150,000 |
| Billed unmetered consumption | 10,000 |
| Unbilled metered consumption | 5,000 |
| Unbilled unmetered (flushing, firefighting, mains work) | 15,000 |
| Authorised consumption | 1,180,000 |
| Water losses | 320,000 |
| Unauthorised consumption | 6,000 |
| Customer meter inaccuracy and data-handling error | 34,000 |
| Apparent losses | 40,000 |
| Real losses (CARL) | 280,000 |
280,000 m³ a year is 767 m³/day. That is the numerator.
Three notes on the rows people get wrong:
UARL means unavoidable annual real losses: a modelled reference level for a well-managed network. The formula below expresses it as a daily volume. Use the same units for CARL and UARL before dividing.
UARL (litres/day) = (18 × Lm + 0.8 × Nc + 25 × Lp) × P
Each input has a usual source and a usual failure:
| Input | Where it comes from | What goes wrong |
|---|---|---|
| Lm — mains length, km | GIS network layer | Abandoned mains still in the layer; new-build not yet added |
| Nc — number of service connections | Asset register, checked against billing records | Counting customer accounts or individual flats instead of physical service connections |
| Lp — underground service pipe, property boundary to meter, km | Estimated from connection count × average length | Set to zero because “meters are at the boundary” when they are not |
| P — average operating pressure, m (1 bar ≈ 10.2 m) | Zone pressure logging | A nominal figure from a design drawing, or one point taken as the zone average |
Lp is the total length of underground pipe from property boundaries to customer meters across the network. Estimate it as connection count × average underground length, then convert metres to kilometres. In this example, 7,500 × 2 m = 15 km. Use zero only where meters really are at the boundary.
Pressure multiplies the whole UARL expression. With CARL unchanged, overestimating pressure raises UARL and lowers ILI. Use a representative average for the network and assessment period.
For our network:
| Input | Value |
|---|---|
| Mains length (Lm) | 210 km |
| Service connections (Nc) | 7,500 |
| Underground service pipe (Lp) | 15 km |
| Average pressure (P) | 42 m (≈ 4.1 bar) |
UARL = (18 × 210 + 0.8 × 7,500 + 25 × 15) × 42
UARL = (3,780 + 6,000 + 375) × 42
UARL = 10,155 × 42 = 426,510 litres/day, or 426.5 m³/day
ILI = CARL / UARL = 767 / 426.5 = 1.80
Four checks before you use the result:
Non-revenue water is system input minus billed authorised consumption: 1,500,000 − 1,160,000 = 340,000 m³, or 22.7% of system input. This includes 20,000 m³ of unbilled authorised consumption, 40,000 m³ of apparent losses and 280,000 m³ of real losses. It is not all leakage.
The same network has an ILI of 1.80: estimated real losses are about 1.8 times the UARL benchmark for its size and pressure. This alone does not establish whether further leakage reduction is worthwhile.
The two indicators answer different questions. Non-revenue water describes the share of input that is not billed. ILI compares real losses with a network-specific benchmark. Lower consumption can increase the percentage even when leakage is unchanged, so report both with their context.
Use the percentage to explain the water balance and ILI to support a technical comparison of leakage.
Whatever produced the number has to survive being asked about — by a regulator, an auditor, or your own successor. Keep the assessment period and boundary definition, every balance component with its source, an explicit note on which components were estimated and how, the four UARL inputs with their dates, and the pressure measurement method.
A number nobody can reconstruct is a number that has to be redone.
The balance is the hard part, and it is hard mostly because of timing and data quality rather than arithmetic. Water loss management on Divako keeps system input, billed consumption and the zone hierarchy in one place, validates readings before they are subtracted, and recomputes the balance as data lands rather than once a year — so the CARL estimate can be traced back to its inputs and updated as better data becomes available.
You still need asset records, representative pressure measurements and documented estimates for unmetered consumption and apparent losses. The platform helps organise the evidence; the calculation remains only as reliable as its inputs.
For the regulatory context — who has to assess, by when, and what happens in 2028 — see the Drinking Water Directive page.
A practical guide to the IWA water balance: its components, data sources and the checks needed for a reliable leakage estimate.
The Drinking Water Directive names ILI as the method for assessing leakage. What the index is, how UARL is calculated, a worked example, and the systems where it does not apply.
Every water network loses water – the question is how much, and where. With the EU's Drinking Water Directive turning leakage into a reportable number, the water balance is moving from an annual estimate to an operational tool.
Your network
Send us your zone layout and current metering setup. In a 30-minute demo, we will review which inputs you have and where better data is needed.