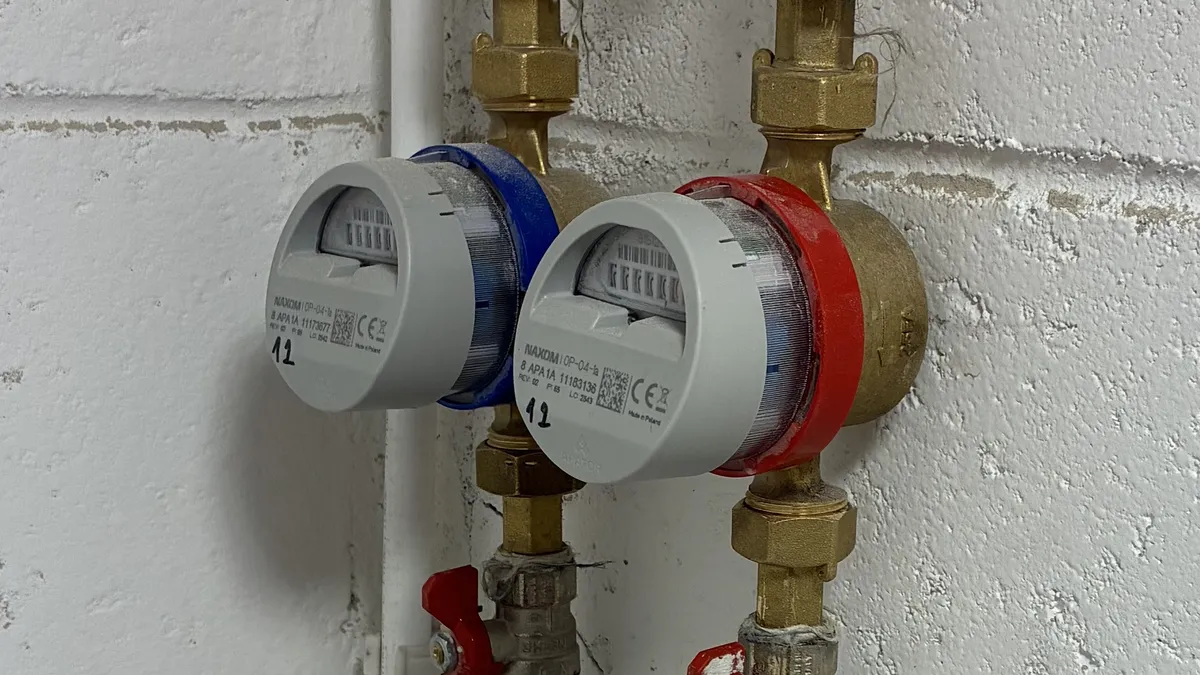
Minimum night flow (MNF) analysis, step by step
A worked minimum night flow analysis: find the night minimum, subtract legitimate use, apply the night-day factor and check the result against the balance.


Industry · 16 November 2026
Subtracting two meter readings is easy. Building a trustworthy hourly consumption profile takes a few more checks. Here is a worked example with missing hours, duplicate messages and a meter change.
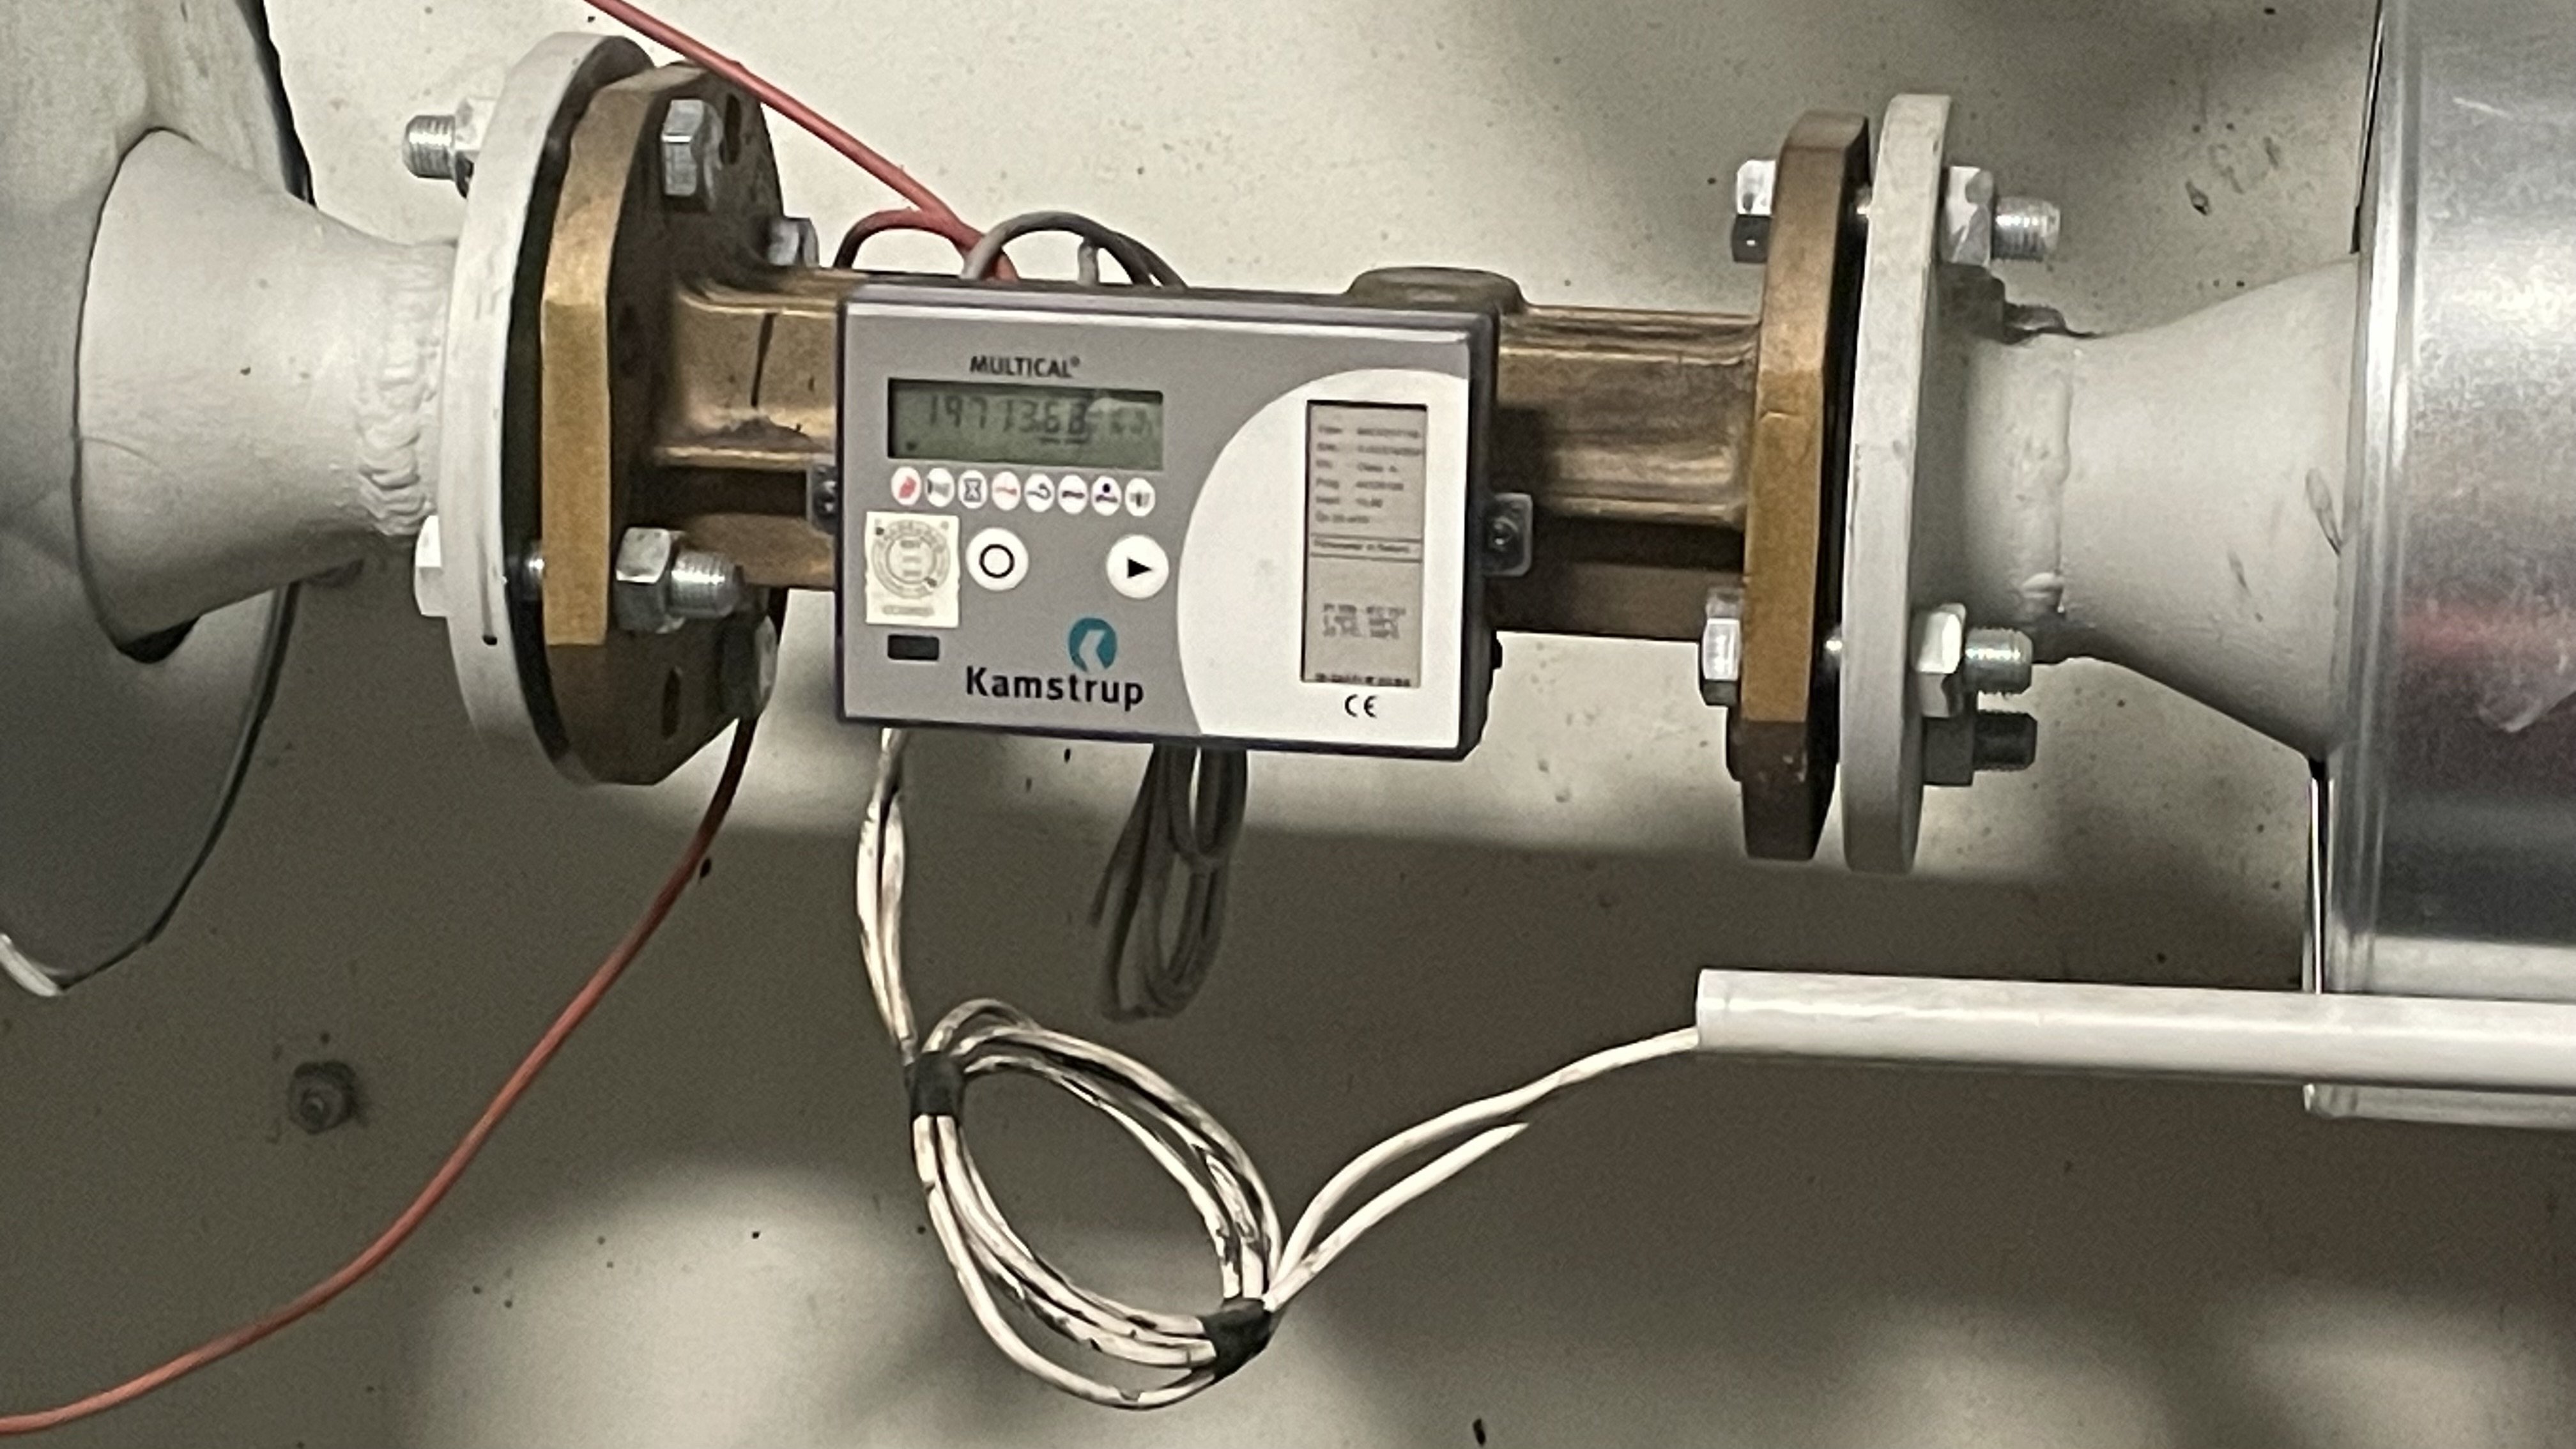
A water meter sends a reading of 1,234.500 m³ at midnight. Four hours later it reports 1,235.500 m³. The difference is 1 m³, or 1,000 litres. But when was that water used?
That is the question behind an hourly consumption chart. It matters when checking a building’s overnight use, comparing zones or investigating a sudden rise in demand. A correct total can still hide a misleading hourly profile.
The example below uses invented readings from one cumulative forward-volume register. It is a calculation exercise, not a customer case study or a claim about a particular meter’s accuracy.
Before subtracting anything, establish whether the payload contains a cumulative volume, an interval volume, or a flow rate. They need different calculations. This guide uses cumulative volume in m³.
Keep the meter identity, register identity, unit and scale with each reading. A forward-volume register and a reverse-volume register are separate series. For example, Kamstrup’s flowIQ 2200 data sheet lists volume and reverse volume separately in its data registers. Check the documentation for the actual model and payload you receive.
Also retain two timestamps where available:
Calculate consumption using measurement time. A batch of historical readings arriving at 08:00 does not mean all the water was used at 08:00. If the measurement time is unknown, make that limitation visible.
For two accepted readings from the same uninterrupted register:
Volume used (L) = (later reading − earlier reading) × 1,000
Average flow (L/h) = volume used (L) ÷ elapsed time (h)
The factor 1,000 applies because the source readings are in m³. It would be wrong for a source already reporting litres.
Here is the small dataset. All measurement times are on the same day, in UTC; the register values use a decimal point.
| Measured at | Register (m³) | What arrived |
|---|---|---|
| 00:00 | 1,234.500 | First reading |
| 01:00 | 1,234.650 | Next reading |
| 01:00 | 1,234.650 | Exact retransmission |
| 03:00 | 1,235.050 | No 02:00 reading yet |
| 04:00 | 1,235.500 | Next reading |
Use the retransmission once in the calculation. Keep the original messages for traceability. The resulting intervals are:
| Interval | Elapsed time | Volume used | Average flow |
|---|---|---|---|
| 00:00–01:00 | 1 h | 150 L | 150 L/h |
| 01:00–03:00 | 2 h | 400 L | 200 L/h |
| 03:00–04:00 | 1 h | 450 L | 450 L/h |
The middle row is a two-hour interval. Its 200 L/h is an average across those two hours. It does not establish that exactly 200 litres were used in each hour, or that water flowed continuously.
The endpoint readings establish a total of 400 litres between 01:00 and 03:00, assuming the register remained valid and continuous. They do not reveal its distribution within that interval.
Two tempting shortcuts change the meaning of the data:
If a report needs hourly bars, an even split can be a documented estimate, clearly marked as such. For investigating continuous night use, keep the gap visible: the same 400 litres could represent a short draw or steady use. The average alone cannot distinguish them. Our minimum night flow guide explains what else a leakage assessment needs.
The same issue occurs with readings at 01:10 and 02:10. They cover one elapsed hour, but neither the complete 01:00–02:00 clock hour nor the complete 02:00–03:00 hour. Dividing them between clock-hour buckets requires an assumption or additional readings at the boundaries.
Suppose the missing 02:00 reading arrives the next morning: 1,234.700 m³. After validation, insert it by measurement time and replace the original two-hour interval with:
| Interval | Calculation | Volume used |
|---|---|---|
| 01:00–02:00 | (1,234.700 − 1,234.650) × 1,000 | 50 L |
| 02:00–03:00 | (1,235.050 − 1,234.700) × 1,000 | 350 L |
The total remains 400 litres. The profile changes substantially. Rebuild the affected chart, aggregates and exports, and retire any estimates they replace. Do not add the new intervals on top of the old 400-litre interval.
An exact duplicate and a conflict need different treatment. Two copies of the same sample can contribute once. Two different values claiming the same meter, register and measurement time need investigation; arrival order alone is not a sound rule for choosing the correct one.
Imagine that the old meter ends at 1,235.500 m³, while the replacement starts at 0.020 m³. Subtracting one from the other gives −1,235.480 m³. That is not consumption.
Start a new register segment for the replacement. Record the old meter’s final reading, the new meter’s initial reading and their timestamps. Calculate each meter’s consumption within its own segment, then combine the volumes for the installation. If readings around the exchange are missing, the uncovered period remains uncertain.
For an unexpected decrease without a recorded exchange, check the register definition, possible reset or rollover, reverse flow and decoding. Only correct a rollover when the register’s modulus and the event are established. Do not use the absolute value of the decrease or silently replace it with zero.
These are specific applications of validation, estimation and editing (VEE): preserve the original reading, record the decision and distinguish measured inputs from estimates.
For an uninterrupted segment with accepted endpoint readings, adjacent interval volumes must add up to the endpoint difference:
150 + 400 + 450 = 1,000 L
After the late reading arrives:
150 + 50 + 350 + 450 = 1,000 L
Both agree with (1,235.500 − 1,234.500) × 1,000. If your chart does not reconcile, look for a duplicated interval, an omitted boundary, a unit conversion or a correction that did not reach the aggregate. Keep sufficient precision during calculation and round for display at the end.
Use actual elapsed time for the denominator. Store unambiguous instants, and apply the installation’s local time zone when presenting clock-hour and daily totals. A local day affected by a clock change is not necessarily 24 hours; the PostgreSQL date/time documentation illustrates why calendar-day and 24-hour arithmetic can differ.
Take one meter and one day’s raw readings. Keep the readings at both day boundaries, or mark any boundary estimates. Then check:
This gives you a traceable consumption profile before you use it for alarms or reports. If the next task is collecting the readings reliably, start with our overview of remote water meter reading.
A worked minimum night flow analysis: find the night minimum, subtract legitimate use, apply the night-day factor and check the result against the balance.
What VEE means for meter data: the validation checks that matter, when estimation is allowed, how edits must be recorded, and what the EU rules and IEC 61968-9 expect.
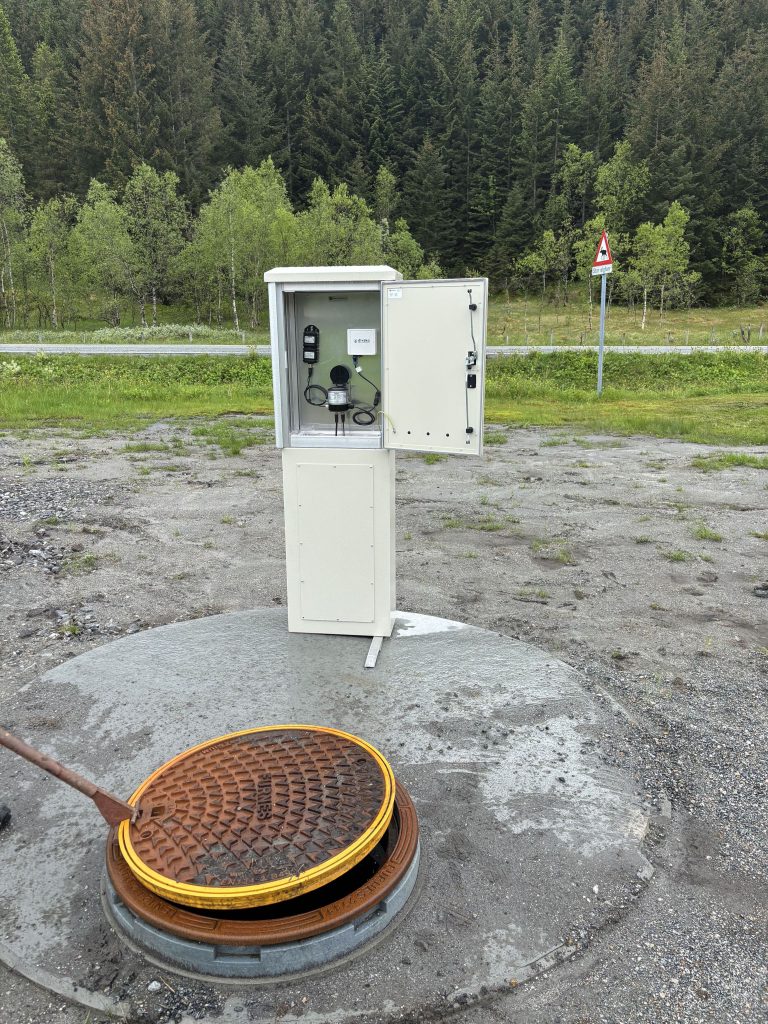
Download a free water balance worksheet, follow a worked example and see how input errors affect the leakage estimate.
Your meter data
Tell us which meters you use and how often you receive readings. We can discuss how to turn them into consumption profiles and useful checks in Divako.